a little introduction into Monitoring Computer systems:
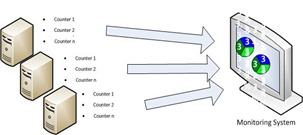
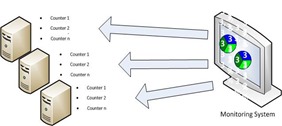
Computer system monitoring is a practice of collecting representative counters for computer systems you want to know the status of.With monitoring there are two endpoints ‘talking’ to each other: Server and Client. The Server’s primary role is to collect counters of Clients. The Client presents a set of counters to the Server system.
Monitoring globally knows two types of methods to collect these counters, Client push and Server Pull


Ways of communication
There are 3 communication methods known to monitoring components:- Real time monitoring
- Scheduled monitoring
- Triggered monitoring
The main problem with Real time monitoring is the communication of the systems; with this methodology the client must always have access to the server system and it must also have a way to deliver its data to the ‘right destination desk’ on the Server system. with a limited amount of systems this can work without any addition overhead but when the amount of clients systems increases the problem of communication and counter delivery becomes prominent. this way of working can only work very good when the communication is managed by a very strict managing system but even then it becomes unmanageable when too much systems are plugged in.
When you use scheduled communication as means of monitoring the afore mentioned problems become less significant because the initiating component of the monitoring system will fetch the data of a system on fixed times and it already knows the data will be from system xyz and because of this will store the data on the place it holds all data of system xyz.
Using the 3rd method communication method between monitoring components, data transfer is kept to the very minimum, only when a deviation to a known baseline is detected the agent will report this to the server except when it is unable to communicate. in that scenario an action will be triggered on the monitoring server.
Monitoring Agents
The general way to get monitoring like this working is by using agents on client devices. Agents do have one primary function: to execute a task presented by the server component of the Monitoring system.Monitoring agents do come it two categories: the passive agent, and the active agent.
The main difference between these two is the way the agent collects its counters and presents them to the Server.
Passive Agent
Generally passive agents are used by monitoring systems which are based on scheduled device polling, the way this goes is as follows:- The Agents is installed via software distribution or by hand locally
- During installation or later from a external source the agent gets its configuration pushed
- in its configuration, roles are defined to whom the agent may talk and what the agent can monitor
- at a certain point in time the agent receives an external action request
- the first step is a check weather the agent is allowed to talk to the external source, if not the request will be dropped
- when the request is valid the agent will try to execute the request, if it cannot the request is dropped
- the agent reports its status back to the external source
Active Agent
The active agent differs from the passive agent in the way it is configured- and the way it communicates to the server. agents like this generally tend to use the 3rd communication method, it works like this:- Generally the installation of active Agents is begun by a discovery of systems by a monitoring server
- When discovered the system is matched to specified criteria specified on the server, if they match an agent installation is started
- After the installation of the agent, it tries to connect to a monitoring server by itself (generally the server that presented the agent)
- When a server is found the agent requests configuration data, the Server sends configuration data of all available modules to the client
- the agent downloads the configuration data compares it to the local configuration and requests modules and classes for its found configuration
- The server sends the configuration and classes to the agent
- The Agent applies the logic, runs checks and sends this data to the server
- Apart from heartbeat no more communication between agent and server is started except when a deviation from a monitoring rule has been detected by the agent or in the event of a change in configuration on the client has been detected (like an installation of a new application, service etc.)
No comments:
Post a Comment